There are not too many options for working up TMT labeled data with freely available tools. There is MaxQuant and my PAW pipeline.
I have done some comparisons of the TMT quantitative data between MQ and PAW in a few of the analysis notebooks available here. There are differences, but what are the reasons for the differences? There is a general misconception that quantitative data in bottom-up proteomics experiments is somehow independent of the search engine identifications and protein inference. Nothing is farther from the truth.
Background
There are two factors common to all bottom-up quantitative experiments: peptides that map to multiple proteins are a problem, and data has to be summarized at higher levels than peptide-spectrum-matches (PSMs). There are other common data analysis actions that will not be discussed here, such as filtering out low quality data points, data points from co-fragmented peptides, and what to do with zeros/missing data. Sometimes these are obvious how to do (and when), and other times they are more complicated.
What does this mean for pipeline designs? Extracting the quantitative information (MS1 features or reporter ions) might be done in an early pipeline step before database searching has been done. It could also be done after sequences have been assigned to spectra and some separation of incorrect from correct assignments has been done (mostly target/decoy these days). Post filtered PSMs are most commonly used if the quantitative extraction is expensive (like extracted ion chromatograms). Why suffer the cost of extracting data that will not be used?
Either way, some extracted quantitative data will be discarded based on the final protein inference outcome. There may be proteins (and their associated PSMs) that are rejected to achieve a desired protein FDR. There may be peptides deemed unusable for quantification based on the final list of proteins (shared peptides, mostly). The coding will involve extracting quantitative values and saving them in an appropriately keyed data structure. After the identifications and protein inference has been completed, the relevant quantitative data can be retrieved and processed. The protein inference will dictate how the quantitative data is summarized for final reporting.
The sensitivity of PSM assignments (the number of filtered PSMs at a given false discovery rate) and the protein inference philosophy will have a very strong influence on the final quantitative results. Different processing of the same starting data will likely have different results. We will look at three experiments of TMT-labeled human platelet samples. They were labeled with 10-plex TMT, separated into 18 fractions, and analyzed on an Orbitrap Fusion using the SPS MS3 method. The data were processed by MQ version 1.6.5.0 and by the PAW pipeline using Comet version 2016 release 3.
Design choices for PAW pipeline:
- wide parent ion mass tolerance
- scores are discriminant function (XCorr and deltaCN)
- accurate mass conditional score histograms
- target/decoy PSM FDR by peptide subclasses
- parsimonious protein interference (2 peptides per protein)
- protein grouping to refine shared/unique peptide status
Design choices for MaxQuant:
- very narrow tolerance searches
- scores are Andromeda primary match scores
- target/decoy PSM FDR (peptide length and maybe other subclasses)
- parsimonious protein inference using all-or-nothing razor peptide method
- single peptide per protein IDs and heuristic protein ranking function FDR
PSM performance
The same canonical UniProt human reference FASTA protein data base was used (about 21K sequences). For the PAW analysis, a concatenated target and reversed sequence decoy database was used. It contained common laboratory contaminant sequences. MaxQuant has built-in support for contaminants and decoys. PSMs were filtered to 1% FDR in both analyses. MaxQuant does its own RAW file processing. The PAW pipeline relies on MSConvert and Python scripts to generate MS2 format input files for Comet. Table 1 below has the numbers of fragment ion spectra (scans) searched, the number of identified scans at a 1% FDR, and ID rate for each pipeline.
Table 1. Dataset sizes and identification rates (decimal is period).
| Sample | PAW All | PAW ID | PAW Rate | MQ All | MQ ID | MQ Rate | Gain |
|---|---|---|---|---|---|---|---|
| ASLA515 | 334834 | 89599 | 27% | 348290 | 64361 | 19% | 39% |
| ASLA603 | 289891 | 109989 | 38% | 299474 | 93808 | 31% | 17% |
| ASLA626 | 300077 | 117280 | 39% | 313821 | 92710 | 30% | 27% |
| Total | 924802 | 316868 | 34% | 961585 | 250879 | 26% | 26% |
The significantly greater numbers of identified PSMs at a 1% FDR for the PAW pipeline versus MaxQuant is typical from comparisons I have done of many datasets over the past few years. Andromeda was initially benchmarked against Mascot and had similar performance. The main score function in Mascot does not separate decoy scores from target scores as well as transformed SEQUEST scores. That is why Mascot Percolator significantly outperformed other Mascot search processing.
With SEQUEST-like search engines (SEQUEST and Comet), using only the XCorr score is not as good as using combinations of scoring information. There are two commonly used ways to make a better scoring function for SEQUEST: the linear discriminant function approach from Peptide Prophet or the machine learning approach of Percolator. The PAW pipeline uses the Peptide Prophet approach (a static classifier). Comparisons of PAW to Proteome Discoverer (SEQUEST/Percolator) have had similar numbers of identifications at the same FDR or slight advantages for PAW. I have never found any evidence to support the added complexity of a self-trained support-vector machine classifier for any of the data I have worked with.
Regardless, a better composite score function for Andromeda would likely improve MQ performance. Wide mass tolerance parent ion settings also improve sensitivity and increase the discriminating power of accurate mass information. This was reported a decade ago and largely ignored. I am not trying to make any claims that the PAW pipeline is the most sensitive data processing. I have not had time to benchmark MSGF+, MetaMorpheus, or MSFragger. These newer tools have enhanced capabilities and leverage the improved resolution and accuracy of current instruments. There are many factors that make fair comparisons surprisingly difficult, as discussed here.
Protein performance
Protein inference can be a complicated and opinionated topic. The basics have been very nicely described by Nesvizhskii and Aebersold. There seems to be some agreement in the field about grouping redundant proteins and removing subset matches. How to control protein reporting errors has been much less standardized. There are many ad hoc heuristics in use. Many approach the problem like it is similar to the statistical treatment of PSM scores. It is not. While a target/decoy counting does give some ballpark estimate of the protein error rate, there are insufficient numbers of target and decoy proteins for any valid statistical assessment. You would need an actual protein decoy score distribution that is not present because protein inference typically occurs after PSMs have been filtered to remove most incorrect matches.
The bigger problem is that the relationship between incorrect peptide sequences and incorrect protein sequences is not as simple as PSM score distributions. It is widely known the the number of peptides per protein is somehow related to all of this. That is why the “two peptide rule” is widely used and frequently attacked. If you have some proteomics experience, you probably have some intuition about this problem. If we have too large a PSM FDR, we will likely end up with too many incorrect proteins. If our dataset is really large, the problem seems worse. The problem seems more severe if the database is smaller and less bad when the database is larger. This sounds like a math problem.
The essential mathematics can be found in the Supplemental materials for the MAYU paper. Unfortunately, the paper missed the opportunity to simplify the formula for the typical proteomics case. If we are less concerned with accurate modeling and just want to get the gist of how numbers of incorrect proteins depend on numbers of incorrect peptides, we can make some approximations. The number of incorrect peptide sequences are usually much smaller than the number of proteins in the FASTA database. The numbers of incorrect peptides are typically a few hundred. The number of proteins in protein databases are typically a few to many tens of thousands. Consequently, one of the terms in the hypergeometric probability equation will be so close to 1.0 that we can drop it. Truncated factorials can be replaced with power expressions (100 x 99 x 98 is pretty close to 100^3). There is explicit dependence on the number of peptides per protein. The general form drops off so rapidly with increasing numbers of peptides per protein, that explicit forms for 1, 2 or 3 peptides per protein are all that are relevant.
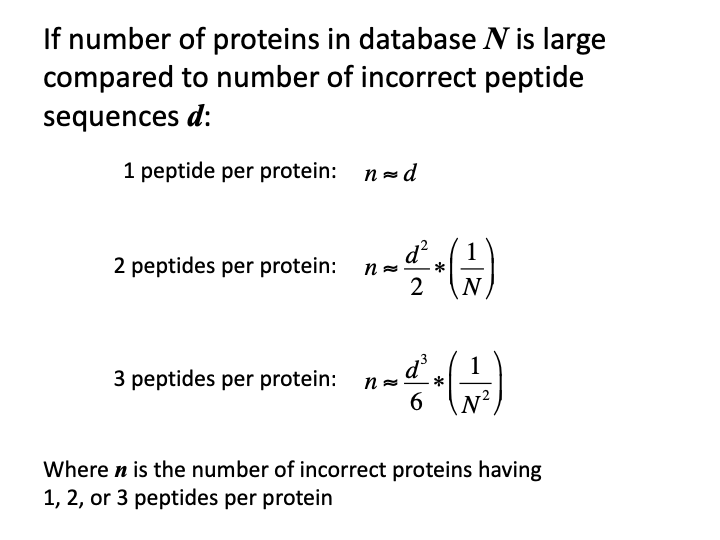
There are a few key points:
- there is a direct dependence on number of incorrect peptides
- there is an inverse relationship with the protein database size
- “rates” are not part of the equations
- the dependence is on the absolute number of incorrect peptide sequences
- formulae predict the absolute number of incorrect proteins
- single peptide per protein IDs have a one-to-one error relationship
- three peptides per protein error numbers are typically very small
- two peptides per protein is the sweet spot (and why we use the two peptide rule)
There are some caveats
- lengths of the protein sequence matters, but are ignored
- protein database size is not really the number of protein sequences
- protein database size is the unique theoretical peptide search space size
- databases with isoforms look larger than they really are
- incorrect matches to correct proteins are ignored
These formulae are only roughly in the ballpark if the number of proteins identified in the sample are a reasonably small fraction of the database size. Scalings of the estimates have to be done if the IDs become too large compared to the target database, something that is a growing issue.
The important point here is that single peptide per protein IDs are fundamentally different from IDs where we have more than one peptide. If protein ranking functions are used, they should be separated into lists based on the number of peptides per protein.
Now that we have some background on how incorrect peptides and incorrect proteins are related to each other, we can look at the target and decoy protein ID counts from the two pipelines.
Table 2. Protein identifications (excluding contaminants).
| Category | MQ Target | MQ Decoy | MQ FDR | PAW Target | PAW Decoy | PAW Rate |
|---|---|---|---|---|---|---|
| All | 4576 | 147 | 3% | 4397 | 144 | 3% |
| Single peptide | 451 | 104 | 23% | na | na | na |
| Two or more | 4125 | 43 | 1% | 4397 | 144 | 3% |
Comparing numbers of PSMs at a given FDR is a straightforward, fair comparison. Comparing proteins with some differences in protein acceptance criteria is much more apples-to-oranges. MaxQuant has more total protein IDs despite having fewer PSMs to work with. That is all because of the 451 single peptide IDs. You get 451 proteins (10% of the total) from 451 PSMs (0.18% of the PSM total). Those are the category where the majority (71%) of the incorrect protein matches are located. We can see how different errors are for single peptide IDs (23%) compared to two or more (1%).
Protein numbers are a poor way to compare two workflows. The numbers of identified PSMs at the same FDR is much better. MaxQuant may have a few more protein IDs, but most of those will have lower quality quantitative data because there will be fewer PSMs for reporter ion sums.
Conclusions
MaxQuant/Andromeda is not a particularly sensitive PSM pipeline. Meta-scoring (combinations of scores and other quantities) and better use of parent search ion tolerances could offer improved performance. Maximizing numbers of identified PSMs will do the most to improve the quantitative data quality. Summing information from more PSMs per protein will improve the protein-level data summaries. Comparing numbers of protein identifications is more challenging than it may at first seem. There are many ways to inadvertently inflate protein numbers. Counting PSMs is far safer.