A comparison of narrow parent ion mass tolerances and wide parent ion mass tolerances.
Introduction
Back on March 26, 2021, I posted a Twitter poll asking what parent ion mass tolerance people thought would give the best search engine results. There were 193 votes cast:
| Tolerance | Votes |
|---|---|
| 10 PPM | 59.1% |
| 50 PPM | 18.7% |
| 1.25 Da | 8.8% |
| Something else | 13.5% |
I occasionally read the literature, so I knew what results I was going to see. The narrow tolerance search has won “the Franchise Wars” (movie quote reference from Demolition Man) and become the Taco Bell of proteomics, so to speak.
The Orbitraps from Thermo were the first wave in high resolution, high mass accuracy instruments to gain popularity. Previous Thermo instruments were more “mass suggestion” than “mass” spectrometers and one of the first things Thermo users did with Orbitraps was to adapt previous proteomics tools like SEQUEST to this new world. The first generation instruments were hybrids with the Orbitrap analyzer frequently used for survey scans and the linear ion trap used for the fragmentation and MS2 analysis. This created a situation where the MS2 spectra were largely unchanged from older instruments but the survey scans were very different.
The early tools and tricks of the trade did surprisingly well with nominal masses, which was what the MS2 spectra still were. It seemed logical that existing search engines could be adapted to the new data because the MS2 data had not changed. What had changed was the precursor ion information. Peptide charge states and monoisotopic masses could finally be known with some confidence. Search engines have parent ion mass tolerance settings, so an obvious question was what parent ion mass tolerance setting to use for Orbitraps. The MacCoss lab asked and answered this question way back in 2010 (link to the paper).
Hsieh, E.J., Hoopmann, M.R., MacLean, B. and MacCoss, M.J., 2010. Comparison of database search strategies for high precursor mass accuracy MS/MS data. Journal of proteome research, 9(2), pp.1138-1143.
The answer was that wide tolerance searches performed better. However, that was a long time ago in a galaxy far, far away when the computers were evolutionally closer to slide rules than to today’s super computers that also function as telephones. Narrow tolerance searches were faster (and still are). The convenience of faster searches is what tipped the scales. Convenience is the number one factor that drives wide adoption of any new tech (are you using that BluRay player than replaced the DVD player that replaced the VHS recorder much or are you streaming everything?). And that is where we are today. Sitting in front of idle computers (that are hundreds of times faster than a decade ago) because the narrow tolerance search finished while you blinked. Now that speed is mostly irrelevant, maybe it is time to revisit the question of what parent ion mass tolerance performs best for basic proteomic applications?
There was proteomics before Orbitraps. I know, that is crazy talk, but it is true. We all wore tweed jackets and ties, smoked pipes or cigars, had mustaches or beards, and lived in brick building basements (mostly in the UK). No wait, that was the mass spec world before proteomics led to the discovery of proteins…
What data to use?
Now that we have enormous public data repositories, finding data to use to answer questions is no longer a problem. Do we use some artificial concoction because we think we can predict the outcome? Do we use yeast or HeLa cells? (I think yeast and HeLa cells make perfect proteomics datasets as part of their normal cell cycles.) Or do we go all in with a less than perfect real world sample? Check out the blog post title if you are unsure of the answer…
How about a wide dynamic range biological fluid (urine) from a rarely studied organism (California sea lions) that we know very little about? PXD009019 sounded perfect to me.
Neely, B.A., Prager, K.C., Bland, A.M., Fontaine, C., Gulland, F.M. and Janech, M.G., 2018. Proteomic analysis of urine from California Sea Lions (Zalophus californianus): A resource for urinary biomarker discovery. Journal of proteome research, 17(9), pp.3281-3291.
I had already done a re-analysis of that data in this repository. Ten of the 19 samples were done in May 2017 and the other 9 were done in June. There were some calibration differences between the two sets of runs. I will work up the 9 June samples here because those runs had better mass calibration.
Data processing
The data was analyzed using the PAW pipeline. A general workflow diagram is shown below.
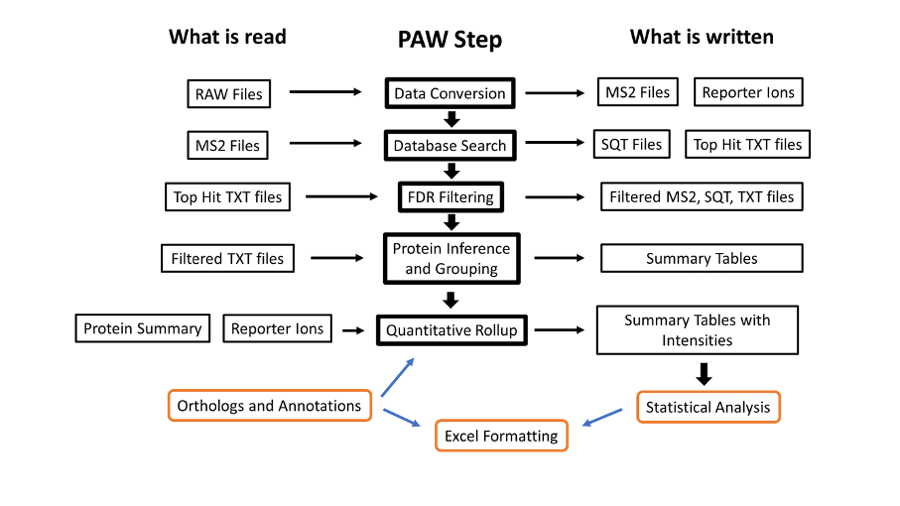
Data conversion uses MSConvert.exe from the Proteowizard Toolkit and the Comet search engine (version 2016013). Both programs are Windows software and freely available. The rest of the downstream steps are written in Python 3.x and can be run on multiple platforms.
In this exercise, we are changing Comet search parameters that relate to parent ion mass tolerance and counting how many PSMs (peptide-to-spectrum matches) we get at 1% FDR (false discovery rate) determined using the target/decoy method. We will explore a series of parent ion mass tolerance setting changes in Comet:
- Different parent ion mass tolerances only
- 10 parts per million (PPM)
- 20 PPM
- 50 PPM
- 1.25 Daltons (Da)
- Different tolerances with isotopic errors
- Different tolerances with isotopic errors and deamidation
Monoisotopic peaks, isotopic envelopes, and deamidation
Disclaimer: I do not like ratios and parts per million is yet another ratio. Proteomics would be so much better off without ratios.
Narrow tolerance searches usually have the delta mass window between measured masses and candidate peptide sequence masses specified in part-per-million (PPM). This means that the parent ion mass tolerance window varies with the peptide mass. Comet works with peptide masses in MH+ units. That is a shortcut for the 1+ ion mass (the peptide molecular weight plus the mass a hydrogen ion). For a 2000 Da peptide, 10 PPM is plus/minus 0.02 Da (0.04 Da for 20 PPM and 0.10 Da for 50 PPM). These are generally small mass differences.
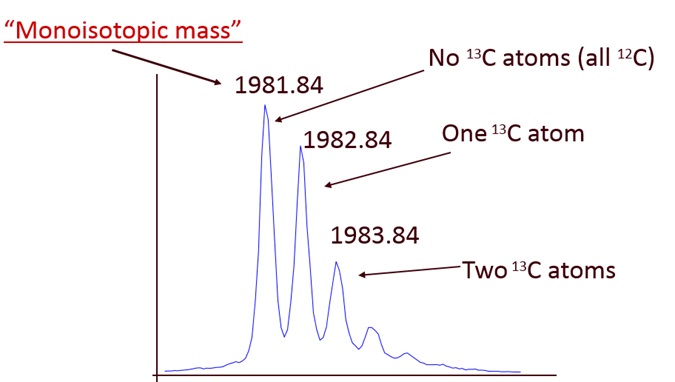
The mass spectrometer sees peptides as sets of evenly spaced peaks. Ions come in different charge states (like 2+ or 3+) and that results in different m/z values. Each m/z region is not a single peak but a series of peaks separated by the masses of neutrons (1.003 Da is the mass difference between C12 and C13) (see this image or Google “peptide isotopic pattern images”). The first peak of isotopic envelopes is called the monoisotopic peak and is the mass value we want to use for a peptide.
During acquisition, the instrument has to try and find these isotopic patterns in real time to select ions for fragmentation. That is not easy. When peptides get larger, the monoisotopic peak gets smaller and the heavier isotopic peaks get larger. Instruments often miss the first peak (the monoisotopic peak) and mistakenly think the peptide mass is the M1 peak (the first isotopic peak). The second peak can also be mistaken for the monoisotopic peak (this happens less often). These peaks, that are 1.003 or 2.006 Da heavier, are (literally) in the next Zip code when we use narrow tolerance searches and PPM scales.
We would never score the correct peptide match for these isotopic errors unless our search engine was smart enough to know that the instruments can make these very specific errors. Luckily, the folks that write search engine software are pretty smart. They have options to try a set of isotopic errors when using narrow tolerance settings. Instead on a single, very tight window around the measured mass value, several narrow windows are used to cover the isotopic peak locations.
We often add oxidation of methionine residues to searches because this happens during sample processing and is in the ballpark of being “too abundant to ignore”. Deamidation of (mostly) asparagine residues is also a pretty common sample processing artifact, particular for certain motifs (such as xxxNGxxx). Note deamidation of glutamine is much less likely. The mass shift when an amide is converted to an acid is +0.984 Da. This is very similar to the +1.003 Da isotopic peak shifts.
This raises several annoying questions. Should deamidation be added as a variable mod for narrow tolerance searches? Should both Asn and Gln residues have deamidation or just Asn? Will allowing isotopic errors let deamidation be found without having to specify deamidation as a mod? It is hard to know how much deamidation your bench work will introduce. Since deamidation is sequence and residue dependent, it will also depend on the proteins in your samples. Deamidation of Gln can be skipped (it does not really happen during any sane protocols).
Deamidation and the M1 peak are so close in deltamass that they will have crosstalk. The search engine scoring function does not care about the deltamass. It just scores candidate sequences and reports the best score. For example, an unmodified peptide might have had the M1 peak isolated. If the sequence has an N residue and deamidation is specified, the top score might be the deamidated form instead of the unmodified peptide. Having a mass shift of +0.984 instead of +1.003 will not get you the correct peptide mass. There will be a 19 milliDa discrepancy. You might catch deamidated peptides (without having a variable mod for deamidation) during the isotopic peak error tries if the narrow tolerance is not too narrow. Five or 10 PPM are too narrow. 20 PPM or larger might be okay. How do you know for sure? Exactly. Deamidation is an ugly complication, but only for narrow tolerance searches.
Let’s ask the data what to do
Unless we are parked on a bar stool with a cold beer (warm beers are okay, too), speculation is a waste of time. There is no written rule that I know of that says you cannot analyze the same data in different ways to figure out what works best. Instead of clinging to some famous group’s highly cited paper’s methods section like a lifejacket, you can just figure it out yourself. All it costs you is some computer time.
It took proteomics a long time to find the secret sauce for optimizing search engine peptide identifications. That secret sauce is the target/decoy method and counting PSMs at the same controlled FDR. This is the evaluation metric we need to spread our wings and fly (informaticically speaking).
That is exactly what I did (and my arms are still sore). I tried different Comet setting on the same data and wrote down the numbers of PSMs at 1% FDR. Then I made this table:
| Parent ion tolerance |
PSMs | PSMs with iso errors |
PSMs with iso errors and deamidation |
|---|---|---|---|
| 10 PPM | 81,655 | 95,311 | 98,251 |
| 20 PPM | 84,068 | 100,554 | 101,233 |
| 50 PPM | 86,216 | 104,751 | 106,776 |
| 1.25 Da | 108,826 | 108,563 | 109,015 |
The small print: Thousands separator is a comma, California sea lion FASTA file, semi-tryptic cleavage with up to 2 missed cleavages, variable met oxidation, static alkylated cys, and high resolution fragment ions.
NOTE: You do not need to allow isotopic errors when doing a wide tolerance search. It is overkill and not recommended. I never bother with deamidation as a variable modification in wide tolerance searches, either.
Interpreting the results
Narrow tolerance searches by themselves (without isotopic errors tried) are quite bad. The reasons are many:
- isotopic errors are not insignificant
- they are affect by mass calibration errors
- the difference between deamidation and the M1 peak becomes important
- accurate mass measurements no longer distinguish correct matches from noise
- narrow tolerances do not reject noise
- narrow tolerances instead select different noise
- deltamass values become a weak classifier feature
When we have a wide parent ion mass tolerance, incorrect matches spread out over the full window width and few incorrect matches will have deltamasses in the narrow regions where correct matches cluster, such as the 0-Da region. The table numbers below are from the runs with different parent ion mass tolerances and no related search engine settings (i.e. isotopic errors). The values are integrated areas of the narrow 0-Da peak (from about the 1/10th peak height levels) for target matches or decoy matches for each charge state.
| Tolerance | 2+ Target | 2+ Decoy | 3+ Target | 3+ Decoy | 4+ Target | 4+ Decoy |
|---|---|---|---|---|---|---|
| 1.25Da | 46,268 | 4,146 | 28,964 | 1,847 | 5,894 | 349 |
| 50ppm | 54,905 | 9,838 | 32,827 | 5,051 | 6,757 | 1,089 |
| 20ppm | 65,618 | 19,699 | 38,263 | 10,021 | 7,838 | 2,087 |
| 10ppm | 75,051 | 30,143 | 40,112 | 13,538 | 7,605 | 2,568 |
This figure show the 0-Da deltamass regions for 2+ peptide and the four parent ion mass tolerance settings:
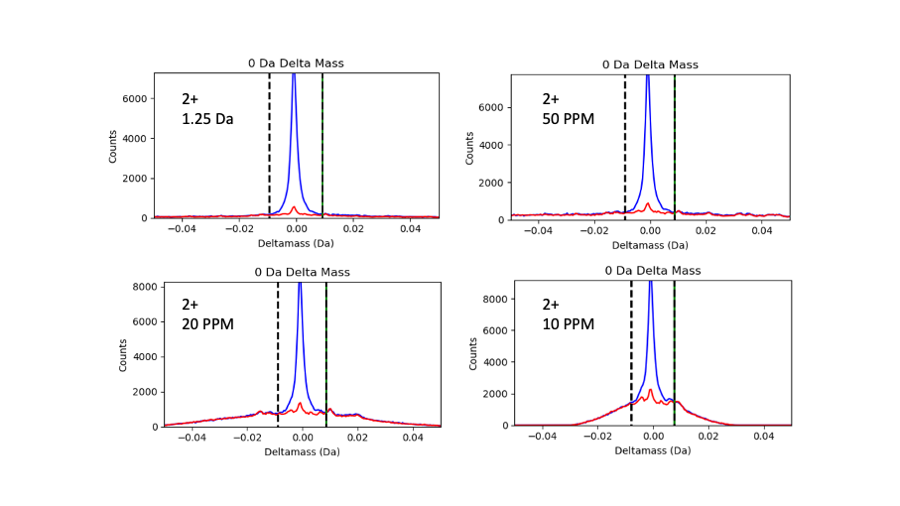
Target matches are in blue and decoy matches are in red. We can see that the noise really piles up under the 0-Da peak as the tolerances get tighter and tighter. Some alternative ways to think about how this accurate deltamass quantity is affect are: the signal-to-noise for the 0-Da peak get much worse, or the probability that a 0-Da deltamass is associated with a correct match decreases dramatically. This table shows signal-to-noise ratios and how much the estimated noise under the 0-Da peak increases as the tolerance gets tighter.
| Tolerance | 2+ S/N | 2+ Noise Increase |
3+ S/N | 3+ Noise Increase |
4+ S/N | 4+ Noise Increase |
|---|---|---|---|---|---|---|
| 1.25Da | 11.2 | 1 | 15.7 | 1 | 16.9 | 1 |
| 50ppm | 5.6 | 2.4 | 6.5 | 2.7 | 6.2 | 3.1 |
| 20ppm | 3.3 | 4.8 | 3.8 | 5.4 | 3.8 | 6.0 |
| 10ppm | 2.5 | 7.3 | 3.0 | 7.3 | 3.0 | 7.4 |
Note: When Comet tries isotopic errors, the reported deltamasses will not change (i.e. do not get close to zero daltons). An M1 trigger will have deltamass around 1.003 Da (remember that Comet reports masses as MH+ masses), an M2 trigger has deltamass 2.006 Da, etc. Although a match may be within 10 PPM of an isotopic peak, how to report that in the results table is something that is not obvious and could vary by search engine. These sorts of things can have implications for downstream classifier tools like Percolator.
The take home message
Is it time to outgrow the limitations of narrow tolerances and go big with the parent ion tolerance? I bet being more tolerant was on your New Year’s Resolution list. Not only do you get the best results, you can ignore all of that other crazy stuff (isotopic errors and the deamidation complications). Putting all joking aside, try wide tolerance setting in your workflows and see if you get improvements. Not all tools will let you get the best results, though. Maybe that should be a good reason to find better tools.
You can make narrow tolerance searches a lot better by allowing isotopic errors. You can get some small further gains with deamidation of N. However, the 1-3% gain from deamidation is probably small enough to think about skipping. It is clear that 10 PPM is too narrow (as would be tighter tolerances). These very narrow tolerances are quite sensitive to any mass calibration errors. Mass re-calibration is an option in many tools, but I think it is still risky.
In terms of low risk of screwing up your analyses, 1.25 Da tolerance gives the best numbers independent of other parent ion mass tolerance settings. Provided you know how to analyze wide tolerance searches (or your pipeline does), this is a real “set it and forget it” situation.
One could say the MacCoss lab got it right eleven years ago (they still do wide tolerance searches, right?) and the proteomics community (cough, cough, MaxQuant, PD, Mascot, etc.) has spent over a decade getting it wrong. Accepting dogma from on high without proof is faith not science. Forget what you read in some high impact article, what some company says in a marketing brochure, what you did yesterday. I would argue that you have a responsibility as a scientist to analyze your data to the best of your abilities. It is very doable to figure out the best way to analyze your data by yourself with current tools and techniques.
While you are sharpening your arrows so you can shoot the messenger (me), there can be computational reasons to need narrower tolerances in many applications. Those are more advanced cases. The basic peptide identification and quantification experiments that are the vast majority of use cases could be significantly improved. What is the point of spending a million dollars to make amazing measurements and then throw away so much data?
Where are the histograms?
I know. I love looking at them, too. They take forever to make. I have to do GUI window captures for lots of deltamass and peptide classes (every changed Comet parameter is a new set of histograms). Those screen captures have to have regions clipped out. Multi-histogram figures have to be made in PowerPoint. There are lots of files to name, organize, and keep track of. I will make a repository with histograms sometime soon. The README files for repositories produce better web viewing of screen shot figures than these blog posts.
The parent ion mass correction repository is a related topic and has many histograms to check out in the meantime.
Thanks for reading!
Phil Wilmarth
April 22, 2021