Understanding TMT Channel Cross Talk
Background
This post will look at TMT channel cross talk (how much each channel is affected by isotopic peaks from other channels) for 18-plex TMTpro reagents.
The same logic below applies to all TMT kits with fewer channels. The tags are the same structures and are subsets of the 18-plex tags.
The unique mass tags range in nominal mass from 126 to 135. They have 8 carbon atoms, one nitrogen atom, and 16 H atoms. The C-series tags range from 126 to 134 in nominal mass (9 tags in total). Each heavier tag corresponds to replacement of progressively more naturally occurring carbon atoms with isotopically enriched C13 atoms until all 8 carbons have been replaced. The heavy carbons are used during synthesis of the TMT reagent molecules to replace specific carbon atoms in the tags and in the mass balancer.
The N-series tags are created by replacing the one N14 atom with an N15 atom. The mass difference between N15 and N14 is 0.997 Da and differs from the mass difference between C13 and C12 (1.0033 Da) by 6 milliDa. With high-resolution instruments, resolutions greater than 50K are sufficient to resolve the N- and C-forms of the tags. The N-series tags are created from the one Da lighter C-series tag; the 127N tag comes from the 126C tag with a substituted nitrogen, etc. We also have 9 N-series tags that range from nominal mass 127 to 135. Note that we have one tag at mass 126 (126C) and one tag at mass 135 (135N).
Naturally occurring elements usually have multiple stable isotopes that all share the same number of protons (their matching number of electrons give us the chemical element) but differ in the number of neutrons. For example, carbon-12 has 6 protons and 6 neutrons. Carbon-13 has 6 protons and 7 neutrons. The TMT tags are only composed of three elements and the isotopic abundances are listed in Table 1.
Table 1. Isotopic abundances for the elements in TMT tags.
| Element | Main form | Heavier form |
|---|---|---|
| Carbon | C12 (98.93%) | C13 (1.07%) |
| Nitrogen | N14 (99.632%) | N15 (0.368%) |
| Hydrogen | H1 (99.989%) | H2 (0.012%) |
For practical purposes, we can ignore the heavy atoms except for the C13. It is the C13 abundance in natural carbon that gives us the typical isotopic distributions of peptides. It is a combination of the abundance of the heavy elemental forms and the total number of those atoms in a molecule that produce appreciable relative intensities for the isotopic peaks. We usually have many more carbon atoms and C13 is relatively more abundant than other element’s heavy forms.
The isotopically enriched C13 and N15 atoms that are used to make the TMT tags are not 100% enriched. Isotopes of elements are typically purified by multiple stages of mass separation in high current instruments. It takes multiple rounds of separation to get progressively more enriched material. The higher the purity, the higher the cost. Typical enrichment factors are 95% purity (cheaper) or 99% purity (more expensive but not outrageous). We will assume the C13 and N15 used in the tag syntheses are 99% pure. When we substitute a naturally occurring atom (that has some heavier forms) with a C13 or N15, we no longer have any possibility of a heavier form. We switch up the problem and now have possibilities of lighter forms. Interestingly, the amount of light atoms in the enriched heavy atoms is about the same as the amount of heavy C13 in naturally occurring carbon. When we substitute a natural carbon atom, we trade roughly an equal amount of heavy form for some light form of the tag. The nitrogen is a little different. We do not have much heavy form from N15 in natural nitrogen (0.3%). We get more light form (1%) from N15, so the situation is not as symmetric as for carbon.
The gist of all this is that as we substitute natural carbon for enriched C13 atoms, we decrease the +1 Da isotopic peak (that comes from natural carbon) and replace that lost signal with -1 Da impurities present in the enriched atoms.
Compute the numbers
Each tag has a different composition of natural atoms and substituted atoms. We know the masses for all of the atoms and we can compute the tag masses for the isotopic satellites associated with each tag. All tags produce one +1 Da form (it comes from the natural carbon atoms). The C-series tags only have C13 substitutions and only one -1 Da form. The N-series tags have both C13 atoms and one N15 atom and will give rise to two -1 Da forms. Table 2 has the numbers.
Table 2. Computing the net tag mass shifts from the isotopic delta masses.
| Tag | Tag MH+ | No. C12 | No. C13 | No. N14 | No. N15 | Heavy Atoms | -1 N | -1 C | -1 Total | +1 C | -1N mass | -1C mass | +1C mass |
|---|---|---|---|---|---|---|---|---|---|---|---|---|---|
| 126C | 126.1278 | 8 | 0 | 1 | 0 | 0 | 0 | 0 | 0 | 8 | 0 | 0 | 127.1311 |
| 127N | 127.1248 | 8 | 0 | 0 | 1 | 1 | 1 | 0 | 1 | 8 | 126.1278 | 0 | 128.1281 |
| 127C | 127.1311 | 7 | 1 | 1 | 0 | 1 | 0 | 1 | 1 | 7 | 0 | 126.1278 | 128.1344 |
| 128N | 128.1281 | 7 | 1 | 0 | 1 | 2 | 1 | 1 | 2 | 7 | 127.1311 | 127.1248 | 129.1314 |
| 128C | 128.1344 | 6 | 2 | 1 | 0 | 2 | 0 | 2 | 2 | 6 | 0 | 127.1311 | 129.1377 |
| 129N | 129.1315 | 6 | 2 | 0 | 1 | 3 | 1 | 2 | 3 | 6 | 128.1345 | 128.1282 | 130.1348 |
| 129C | 129.1378 | 5 | 3 | 1 | 0 | 3 | 0 | 3 | 3 | 5 | 0 | 128.1345 | 130.1411 |
| 130N | 130.1348 | 5 | 3 | 0 | 1 | 4 | 1 | 3 | 4 | 5 | 129.1378 | 129.1315 | 131.1381 |
| 130C | 130.1411 | 4 | 4 | 1 | 0 | 4 | 0 | 4 | 4 | 4 | 0 | 129.1378 | 131.1444 |
| 131N | 131.1382 | 4 | 4 | 0 | 1 | 5 | 1 | 4 | 5 | 4 | 130.1412 | 130.1349 | 132.1415 |
| 131C | 131.1445 | 3 | 5 | 1 | 0 | 5 | 0 | 5 | 5 | 3 | 0 | 130.1412 | 132.1478 |
| 132N | 132.1415 | 3 | 5 | 0 | 1 | 6 | 1 | 5 | 6 | 3 | 131.1445 | 131.1382 | 133.1448 |
| 132C | 132.1479 | 2 | 6 | 1 | 0 | 6 | 0 | 6 | 6 | 2 | 0 | 131.1446 | 133.1512 |
| 133N | 133.1449 | 2 | 6 | 0 | 1 | 7 | 1 | 6 | 7 | 2 | 132.1479 | 132.1416 | 134.1482 |
| 133C | 133.1512 | 1 | 7 | 1 | 0 | 7 | 0 | 7 | 7 | 1 | 0 | 132.1479 | 134.1545 |
| 134N | 134.1482 | 1 | 7 | 0 | 1 | 8 | 1 | 7 | 8 | 1 | 133.1512 | 133.1449 | 135.1515 |
| 134C | 134.1546 | 0 | 8 | 1 | 0 | 8 | 0 | 8 | 8 | 0 | 0 | 133.1513 | 135.1579 |
| 135N | 135.1516 | 0 | 8 | 0 | 1 | 9 | 1 | 8 | 9 | 0 | 134.1546 | 134.1483 | 136.1549 |
Okay, that is a confusing table. We can match the tag masses to the tag names. We will assume each natural carbon position contributes about 1% relative abundance to a +1 Da heavier tag. We will assume each isotopically enriched atom position contributes about 1% to a -1 Da lighter tag (keeping the delta mass differences between carbon and nitrogen in mind). If we assume a relative abundance scale where the abundance of each tag at its quoted mass location is 100, then we can estimate how much relative abundance we would get at adjacent channels for each of the tags in Table 3.
Table 3. TMTpro tags, -1 Da cross talk tags, and +1 Da cross talk tags. Numbers in parentheses are relative abundance estimates for each tag’s isotopic satellite tags, assuming the main tag mass locations would have relative values of 100%.
| Tag Intensity | -1 Intensity | +1 Intensity |
|---|---|---|
| 126C (100%) | 125C (0%) | 127C (8%) |
| 127N (100%) | 126C (1%) | 128N (8%) |
| 127C (100%) | 126C (1%) | 128C (7%) |
| 128N (100%) | 127N (1%), 127C (1%) | 129N (7%) |
| 128C (100%) | 127C (2%) | 129C (6%) |
| 129N (100%) | 128N (2%), 128C (1%) | 130N (6%) |
| 129C (100%) | 128C (3%) | 130C (5%) |
| 130N (100%) | 129N (3%), 129C (1%) | 131N (5%) |
| 130C (100%) | 129C (4%) | 131C (4%) |
| 131N (100%) | 130N (4%), 130C (1%) | 132N (4%) |
| 131C (100%) | 130C (5%) | 132C (3%) |
| 132N (100%) | 131N (5%), 131C (1%) | 133N (3%) |
| 132C (100%) | 131C (6%) | 133C (2%) |
| 133N (100%) | 132N (6%), 132C (1%) | 134N (2%) |
| 133C (100%) | 132C (7%) | 134C (1%) |
| 134N (100%) | 133N (7%), 133C (1%) | 135N (1%) |
| 134C (100%) | 133C (8%) | 135C (0%) |
| 135N (100%) | 134N (8%), 134C (1%) | 136N (0%) |
What patterns do we see? The C-series tags always produce C-series satellites. The N-series tags also have N-series satellites. There is also a constant N-to-C-series scrambling that comes from the N15 atom. This effect is relatively small (and constant) because we have just one nitrogen atom. Generally speaking, the two N- and C-series tags stay within series for adjacent channel cross talk.
Light tags mostly have heavier satellite tags (more natural carbon with fewer substituted atoms). Conversely, heavy tags mostly have lighter satellite tags (less natural carbon and more substituted atoms). Intermediate tags transitions from one extreme to the other in a step-wise fashion. Tags in the middle have roughly equal heavy and light satellite abundances.
Experimental design considerations
This topic was explored for smaller TMT kits by Alejandro Brenes, et al. in 2019 (see Figure 6 in the reference below).
Brenes, A., Hukelmann, J., Bensaddek, D. and Lamond, A.I., 2019. Multibatch TMT reveals false positives, batch effects and missing values. Molecular & Cellular Proteomics, 18(10), pp.1967-1980.
It may be desirable from an experimental design standpoint to allocate samples from each biological condition in a way that minimizes the cross talk between biological groups. We have to recognize that TMT tags do have some cross talk with each other for adjacent (in the N- and C-sense) channels. How much of a nuisance that presents depends on many factors: are channel values being compared at similar intensities or do they vary a lot? The cross talk is more of an issue if the adjacent channel is large and the channel of interest is small. Like life, the rich do more damage to the poor than the other way around. Most inequities are not equal. Do we expect to have very large fold-change values and do we need to measure them accurately? Can there be skipped (empty) channels to minimize cross talk?
To help with experiment planning, Figure 1 shows to what extent lighter tags contribute cross talk to heavier tags. Figure 2 shows how much heavier tags cross talk with lighter tags. Figure 2 also shows the difference between the C-series and the N-series for -1 Da satellites.
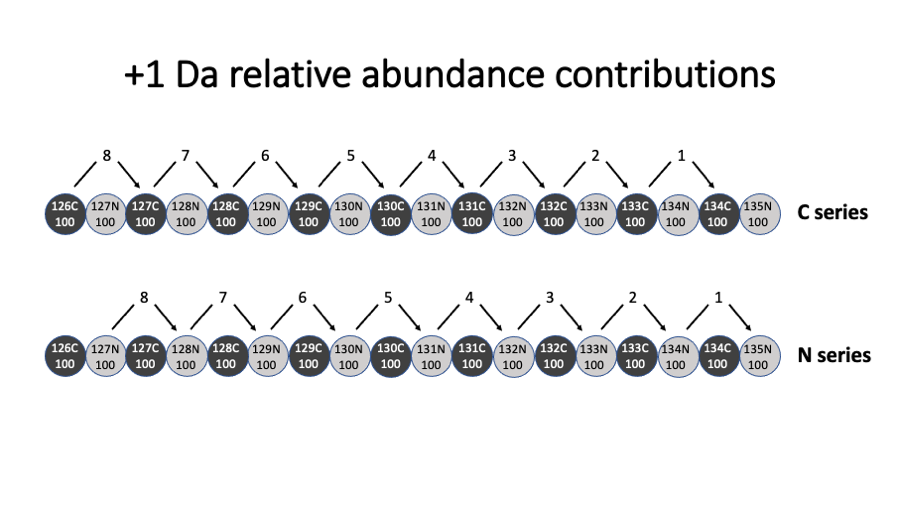
Figure 1. Diagram of which tags have +1 Da satellites and how much relative abundance the tags contribute to their satellites. The top row is for the C-series tags and the bottom row is the N-series tags. It is easier to work through the figures from left to right. For example, if the 126C tag had a peak height of 100 on a relative scale, it would also have a 127C satellite with a peak height of about 8.
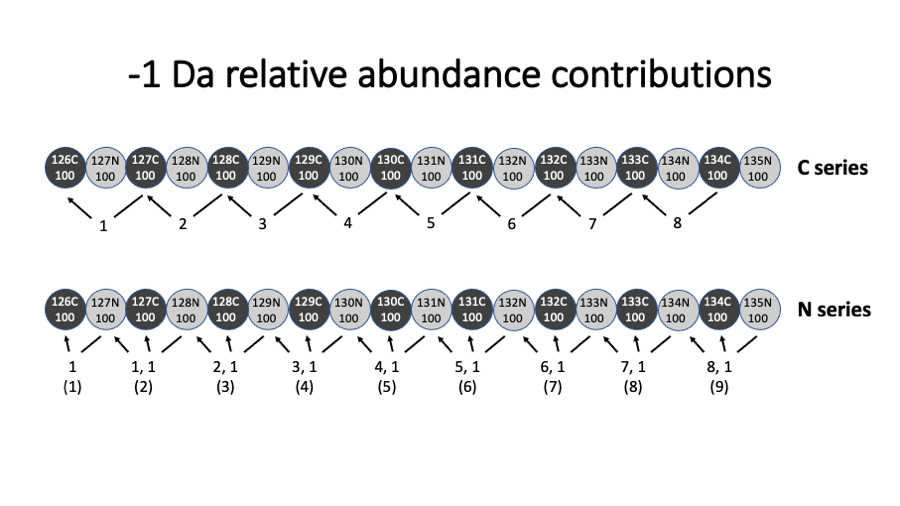
Figure 2. Diagram of which tags have -1 Da satellites and how much relative abundance the tags contribute to their satellites. The top row is for the C-series tags and the bottom row is the N-series tags. The N-series tags have two -1 Da satellites and there is some limited scrambling between the N-series and the C-series tags. It is easier to work through the figures from right to left. For example, if the 135N tag had a peak height of 100, it would have two satellite peaks: 134C with a height of about 1 and 134N with a relative height of about 8.
There may be situations where some way to allocate channels to tags that minimizes cross talk is important. An 18-plex kit can be split into a 10-plex series and an 8-plex series that each have reduced cross talk. This would involve running samples in two separate plexes (and the complication of reference channels if you need more than 8 or 10 channels). Figure 3 shows the two series (10-plex on top and 8-plex on bottom). The cross talk from the satellite peaks associated with carbon atoms can be eliminated. However, the small cross talk of N-series tags to lighter C-series tags cannot be eliminated. Although, the degree of that cross talk is only about a 1% relative effect.
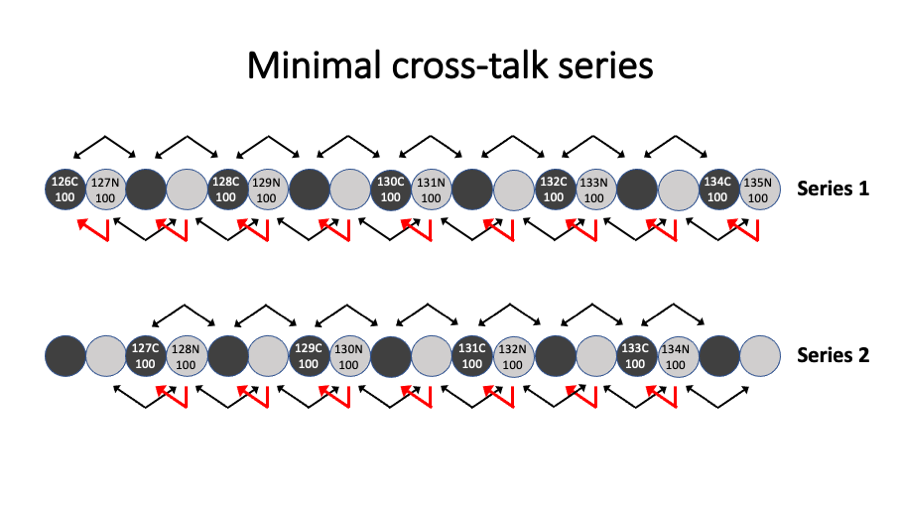
Figure 3. Two possible series (10-plex on top and 8-plex on bottom) with reduced cross talk can be created from one 18-plex kit.
Tags at each end of the tag mass range are cleaner because of boundary effects. There are no tags lighter than 126C and light tags mostly contribute to heavier tag intensities. Similar arguments apply to the heaviest tags. These cleaner channels (see Figure 4) may be good choices for reference channels to get the most accurate correction factors.
Since tags in the middle get some contribution from both lighter and heavier tags in a coordinated way, they would have slightly higher relative intensities (see Figure 5) than the tags at either ends of the tag mass range (assuming we started with equal amounts of each tag).
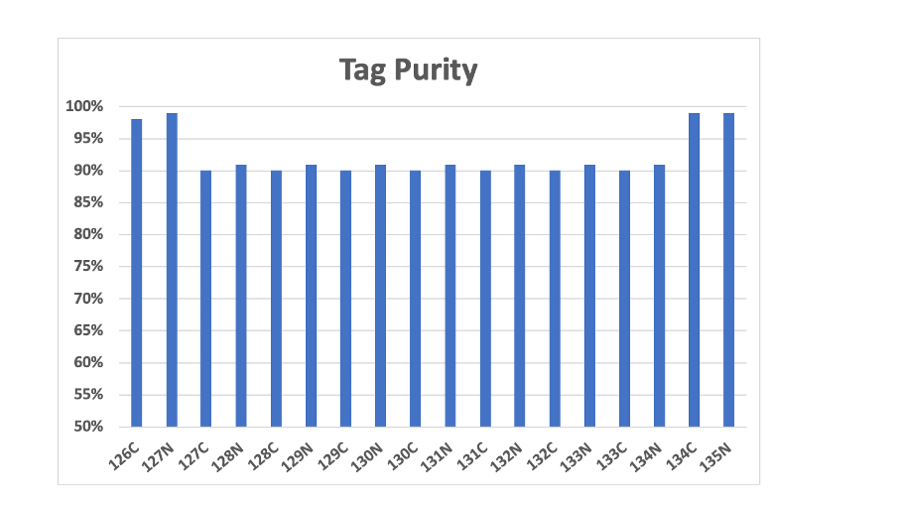
Figure 4. Tag cross talk has a boundary effect. We can add up the total contribution from all adjacent channels for each tag and estimate how much of the tag value comes from the sample of interest. The first two channels and the last two channels have reduced cross talk and may be good choices for reference channels. Note the y-axis starts at 50%.
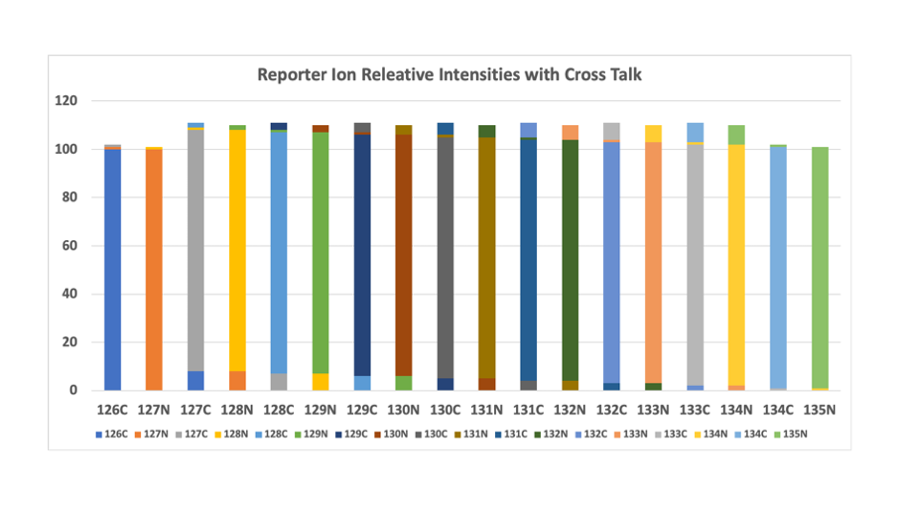
Figure 5. Total tag intensity also shows the boundary effect. The first two tags and the last two tags get reduced contributions from adjacent channels (because the adjacent channels are only on one side) and would have slightly lower total intensity if we mixed together the same amount of each tag.
Conclusions
Adjacent channel cross talk in TMT experiments has been shrouded in mystery for ages. I think it is pretty straightforward to understand if you take a little time to think it though. I estimated the relative contributions of the isotopic satellites without doing any detailed isotopic distribution modeling. Isotopic distribution calculators do not understand isotopically enriched atoms, so I would have to do some work to produce isotopic distributions. This “back-of-the-envelope” calculation is in the ballpark, though. We have some general agreement with the Thermo TMT spec sheet shown in the document link. It is easy to check the measured isotopic distribution for the 126C tag against isotopic distribution predictions. The M1 peak for the 126C tag should be 9.3% (M0 peak of 100%). The QC spec sheet in the Thermo link has a measured value of 7.7% (I think the measured values are under estimated). I ignored the natural abundances of nitrogen and hydrogen. I also ignored any -2 or +2 Da shifts.
To correct or not to correct, that is the question. I do not do isotopic corrections of tag intensities. I do not think the measured relative abundance data in the QC spec sheets are any more accurate that theoretical isotopic calculations (that would never have to be entered into any software). There is the question of when to try to correct things. I feel PSM-level data is too noisy (and it can have missing values). Intensities aggregated to the protein level would probably be better starting data. Not everyone aggregates data to the protein level the same way, though. There are also considerations of how the correction algorithm “cross talks” with normalization steps. Things have to be done in the right order. Thinking all of that though carefully is too risky for me. I just assume there is limited dynamic range in TMT measurements and that large changes may not be as accurate. Some understanding of adjacent channel cross talk can help you design better experiments if wide dynamic range and greater accuracy are critical.
-Phil Wilmarth, OHSU, 20220820