Introduction
The original MaxQuant publication has almost 9900 citations according to Google Scholar. I saw recent tweets where 3500 scientists have already registered for the upcoming MaxQuant Summer School. Those are truly impressive numbers. The impact that MaxQuant has on current proteomics work cannot be understated. A widely used, freely available proteomics “black box” with summer schools, YouTube videos, and a Google discussion group has been a tremendous benefit to the proteomics community.
I am going to raise the uncomfortable question, “Is MaxQuant’s poor peptide identification performance holding back proteomics?” If such a widely used tool is not performing up to par, what is the collective loss for proteomics?
If you are heavily invested in using MaxQuant, please continue reading instead of throwing things at your computer screen. I am not attacking MaxQuant or MaxQuant users. Proteomics has established methods that could dramatically improve MaxQuant performance, provided I can convince anyone that there is a problem to fix. Here goes nothing.
Background
I discuss how shapes, separation, and relative magnitudes of incorrect and correct score distributions affects how many peptide sequences you can assign to spectra at a given false discovery rate here. I also outline the pitfalls of overly tight precursor mass tolerances in this blog post.
A classic paper on the perils of narrow tolerance searches is Cooper, B., 2011. The problem with peptide presumption and low Mascot scoring. Journal of proteome research, 10(3), pp.1432-1435., although 10 or 20 PPM searches with Mascot are the norm not the exception…
We almost universally use the target/decoy method to perform FDR. This has direct dependence on the shapes, separation, and relative magnitudes of incorrect and correct score distributions and how you make use of accurate mass information on modern high-resolution instruments.
Here is some historical background on informatics methods we now rely on in proteomics. About the same time as we were formalizing the target/decoy method (2007) to be able to perform PSM error control, the first use of a machine learning classifier was reported. Percolator was not the first well-performing classifier used in proteomics. The static linear discriminant function used in PeptideProphet, the Trans-Proteomic Pipeline, Scaffold, and my PAW pipeline for SEQUEST/Comet scores is surprisingly effective.
Mascot has had a long and loyal following and its scoring methods have some similarity to those used in MaxQuant. Some 12 years ago, Mascot Percolator was applied to Mascot search results with dramatic improvements. I mean really significant improvements in ID numbers! Interestingly, use of Percolator for Mascot scores may be mostly limited to Proteome Discoverer from Thermo.
In the 14 years since Percolator was developed and the 12 years since Mascot Percolator performed so well, an application to MaxQuant’s Andromeda search engine has not been reported that I am aware of. Percolator (or other machine learning methods) is just one of many ways to take search engine scores and other identification metrics and combine them into superior performing classifier functions. In the same way that Mascot Percolator improves in Mascot’s ion score, the PeptideProphet function greatly improves on SEQUEST’s Xcorr score. Any pipeline that relies on a single primary search function score is just not going to have acceptable performance. This has been demonstrated time and time again over the past decade.
Benchmarking MaxQuant Performance
The first order of business is to evaluate MaxQuant peptide identification performance. We will keep it simple and count the number of PSMs (MS2 scans) that pass a specified FDR cutoff. Counting proteins (instead of PSMs) has strong dependence on protein inference algorithm choices. The numbers of identified proteins (with some set of criteria) are proportional to the number of identified PSMs. The more PSMs we ID, the more proteins we will infer.
Almost no datasets have any known ground truth about how many peptides are really present in the samples. We can run MaxQuant on some different datasets and count the PSMs. However, we will have no idea if those numbers are good or bad. We need some neutral way to get a ballpark on what are good numbers of identifiable PSMs in the datasets we will run MaxQuant on.
My PAW pipeline is freely available and has good performance. Several years ago, I did a lot of benchmarking against SEQUEST/Percolator as implemented in Proteome Discoverer 1.4. PAW PSM ID performance was mostly very similar. Some datasets were a few percent better with PD and some were a bit better with PAW. PAW had 6% more PSM IDs than MSFragger in one comparison. In another comparison where MSGF+ was used, PAW had about 10% fewer PSM IDs. The PAW pipeline is a good performer (and I know how to correctly run this pipeline), so we will compare MaxQuant to PAW.
Design choices for MaxQuant:
- very narrow tolerance searches
- scores are Andromeda primary match scores
- target/decoy PSM FDR (peptide length and maybe other subclasses)
Design choices for PAW pipeline:
- wide parent ion mass tolerance
- scores are discriminant function (XCorr and deltaCN)
- accurate mass conditional score histograms
- target/decoy PSM FDR by peptide subclasses
Test Datasets
PXD002395 from Geiger et al., 2012 - Six-fraction HeLa digest run three ways
PXD019311 from Rad et al., 2021 - Single shot HeLa and yeast digests run in triplicate
PXD003164 from Bayram et al., 2016 - Sperm samples from multiple species
MaxQuant was run with default setting with a couple of exceptions. Protein FDR cutoff was raised from 0.01 to 0.99. Semi-tryptic cleavage was used for the sperm samples. The 19 species in the sperm study were searched against a human canonical database (a closely related organism with a very well characterized genome).
PXD002395 - HeLa digests (each run was 6 fractions)
(thousands separator is a comma)
| Experiment | MS2 Scans | MQ (1% FDR) | PAW (1% FDR) | MQ Loss |
|---|---|---|---|---|
| 20100611 | 159,455 | 103,535 | 113,366 | -8.7% |
| 20100726 | 208,438 | 71,865 | 83,723 | -14.2% |
| 20101224 | 208,221 | 111,894 | 121,495 | -7.9% |
The numbers of identified PSMs (3rd and 4th columns) is roughly comparable for both MaxQuant and PAW. HeLa digests with a modest number of fractions represent a nearly ideal sample. The overall ID rates are high. The total number of matches is determined by the size of the dataset (the number of MS2 scans). In simple terms, what we do not identify (the difference between the MS2 scan total and the identified total) is mostly noise and will be equally split between incorrect target matches and decoy matches. When we can ID most of the spectra, we have less noise to deal with and the sensitivity (recovery) is better.
PXD019311 - HeLa and yeast digests (single shot in triplicate)
(thousands separator is a comma)
| Experiment | MS2 Scans | MQ (1% FDR) | PAW (1% FDR) | MQ Loss |
|---|---|---|---|---|
| HeLa | 216,713 | 53,613 | 69531 | -22.9% |
| Yeast | 185,587 | 53,332 | 66109 | -19.3% |
Here we also have very favorable proteomics samples; however, we do not have as much fractionation (single shot runs). The overall ID rates are lower (i.e. larger relative incorrect distributions) and the recovery is reduced. Here we can think of the number of PAW identifications as a proxy for how many PSMs we could ideally identify. We see larger losses for MaxQuant here.
PXD003164 - 30 sperm samples
(thousands separator is a comma)
| Experiment | MS2 Scans | MQ (1% FDR) | PAW (1% FDR) | MQ Loss |
|---|---|---|---|---|
| Semi - 3% FDR | 549,842 | 52,623 | 106,966 | -50.8% |
| Semi - 1% FDR | 549,842 | 38,646 | 96,524 | -60.0% |
| Tryptic - 3% FDR | 549,842 | 65,754 | 96,263 | -31.7% |
Now things are getting real, as in real world samples. These sperm samples are much more realistic than the HeLa and yeast digests. Like all bio fluids, we would expect to have a sizable fraction of the PSMs that are not fully tryptic (consistent with trypsin cleavage on both ends). There are several reasons why we have peptides that are only consistent with trypsin on one end (semi-tryptic). We can have very minor loss of ID performance for fully tryptic peptides when we increase search space to allow semi-tryptic peptides. That will be more than offset by the additional semi-tryptic peptide identifications.
In the semi-trpytic searches, we are losing over half of the PSMs when we use MaxQuant. That is what I think is unacceptable science. We also see a relatively bigger loss of PSMs when going from 3% FDR to 1% FDR (we will talk about that below) for MaxQuant compared to PAW. Ironically, MaxQuant identifies considerably more PSMs in fully trpytic searches than semi-tryptic searches. That suggests that either the scoring function in Andromeda or the PSM FDR analysis cannot correctly deal with semi-tryptic search spaces (it could be both). We have to get more total PSMs when doing semi-tryptic searches for samples like these. That is just reality.
These samples have lower overall ID rates compared to the less demanding HeLa and yeast samples. We see a clear trend where MaxQuant performance degrades when the number of correct matches is a smaller fraction of all the scans. We often have samples with relatively few correct IDs in real world proteomics. MaxQuant’s poor (and variable ) performance with real world samples raises red flags.
What can we say about score distributions?
MaxQuant does not show you its score distributions (most black boxes are not see-through), but I can make some guesses from past experience with Mascot ion scores. Primary search scores have several major issues with score distributions. Correct and incorrect distributions often have a lot of overlap. We can also have asymmetric distribution shapes. The common cases are a right-hand tail to the incorrect distribution and a left-hand tail to the correct distribution.
Classifier functions often transform score metrics to make distribution shapes more symmetric in addition to improving the distance between the distributions.
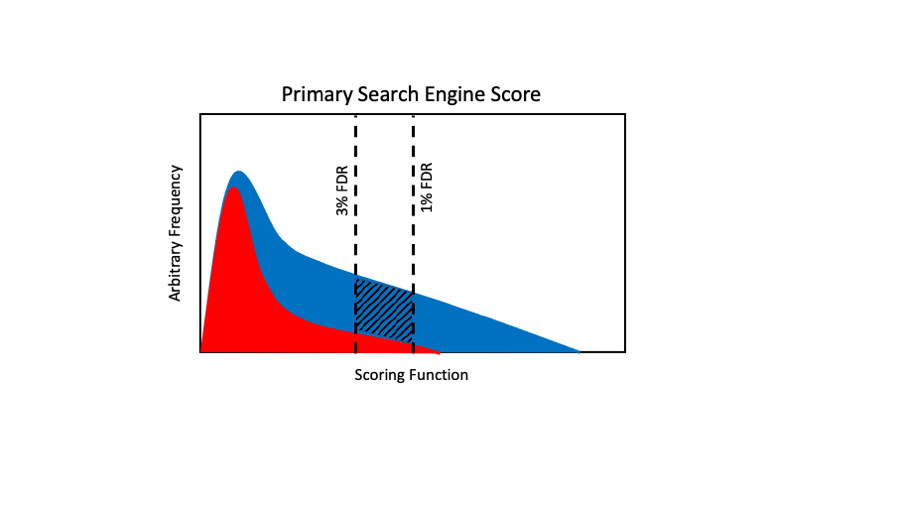
This is an exaggerated primary score distribution case where we have a lot of overlap in the distributions and the incorrect distribution has a long right-hand tail. We would have to set a 1% FDR cutoff at a high score to control the incorrect score distributions right-hand tail. When we have high overlap, then there can be a lot of blue area between the 1% and 3% cutoffs (cross-hatched area). That can result in a lot poorer recovery at more strict FDR cutoffs. We will also have a more significant degradation in performance when the red distribution is relatively larger compared to the blue distribution.
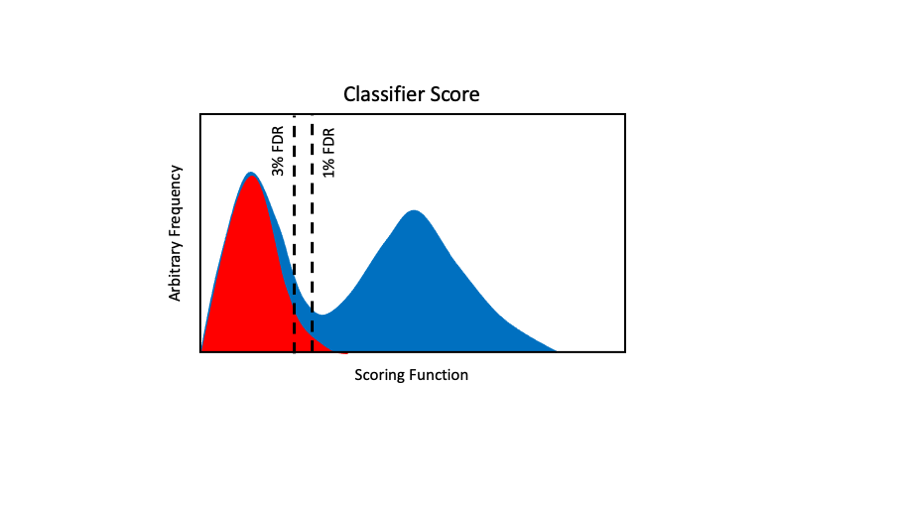
Classifier functions (kind of search engine meta-scores) tend to look more like this. We have distributions with better shapes and the distributions are better separated (less overlap). These cases are less affected by 1% or 3% cutoffs. They are also more independent of the relative sizes of the two distributions. This is something we have all known for more than a decade.
A very important take away is that you can benchmark MaxQuant’s performance on your own data. In addition to my pipeline, MSFragger and Metamorpheus are also freely available and well supported. All you have to do is count PSMs. The MS2 scan count and MS identified count are in the summary.txt file in the MaxQuant txt folder. Make sure you set the protein FDR cutoff to 0.99 instead of 0.01 so that you do not clip the PSM counts.
Professional scientists should evaluate their tools. You do bench protocol optimization. You clean, tune, and test your mass spectrometer. You should also make sure your data analysis is working well enough. Think about organic synthesis. If you do 4 steps at 95% efficiency, you will get 82% yield. If those steps are 80% efficient, your yield drops to 41%. This is why the foundations of your analyses pipelines need to be solid. Adding more and more features to a weak foundation can lead to a total collapse. If you also find that MaxQuant seems to come up short, you have the power to ask the MaxQuant team to fix this. I have been trying for more than two years (see this earlier blog)
Conclusions
MaxQuant/Andromeda is not a particularly sensitive PSM pipeline. It performs better on more ideal test samples and becomes far less acceptable for real world samples. There is a tremendous loss of usable information when using MaxQuant. This degrades all aspects of bottom-up proteomics. There will be fewer protein IDs. The confidence for many proteins would be dramatically improved with increased PSMs per protein. One hit wonders are always sketchy IDs even with current protein FDR methods. Moving more proteins from single peptide per protein IDs to multiple peptide per protein would be a big improvement. All aspects of quantitative proteomics would improve. More PSMs per LC run means better match between run performance. More IDs means fewer missing data points. More PSMs per protein means more reliable quantitative totals for each protein. Identifying fewer PSMs in an experiment will always diminish the results.
Also, these PSMs will tend to be of lower abundance and could be critical for important biological processes.
The solution is quite clear: meta-scoring (combinations of scores and other quantities) and better use of parent search ion tolerances could offer dramatically improved MaxQuant performance. Making use of Percolator with MaxQuant would be a first thing to try. There are many ways to solve this problem, and help the proteomics community do better science.
Phil Wilmarth
May 23, 2021